Master Your Email Sending Frequency & Volume in 2026
Finding the right email frequency is a critical balancing act. Send too few emails, and you’re leaving money on the table. Send too many, and you risk overwhelming your audience; in fact, 49% of consumers report receiving too many emails from brands.
This can crush your deliverability, frustrate subscribers, and cause your unsubscribe rates to skyrocket. The goal is to find that sweet spot that keeps your audience engaged without driving them away.
Mastering your email sending frequency requires a strategic shift. You must move away from a rigid, calendar-based schedule and embrace a dynamic, segmentation-driven approach. This method ensures you deliver emails at the optimal send rates for every subscriber, maximizing engagement and revenue.
This guide will walk you through a three-phase process to master your email sending frequency and volume. We will explore the essential metrics that define success, show you how to calculate your maximum viable email volume, and provide actionable strategies for using behavioral data to optimize your campaign timing.
I. Core Thesis: The Shift to Dynamic Sending
The foundation of a successful email strategy is moving from a static to a dynamic model. Instead of sending the same number of emails to your entire list each week, a dynamic approach tailors the email sending frequency to individual subscribers’ interactions with your brand.
This ensures that your most engaged users receive more communication, while less interested subscribers are not overwhelmed. This method respects the user’s journey and significantly improves key performance indicators.
Key Metrics
To measure the success of your email program, you must focus on three essential metrics. What are the indicators that truly define success?
- Revenue Per Subscriber (RPS): This metric directly ties your email efforts to your bottom line, showing how much revenue each subscriber generates.
- Unsubscribe Rate: This shows the percentage of subscribers who opt out of your emails. A high rate is a clear sign of list fatigue.
- Spam Complaints: This is the most damaging metric. When subscribers mark your email as spam, it severely harms your sender reputation and future deliverability.
Phase 1: The Foundational Equation (Defining Volume)
The first step is to calculate your maximum viable email volume before your key metrics begin to suffer. This phase is about understanding your list’s tolerance and setting a baseline for your sending strategy. By identifying this tipping point, you can avoid over-sending and protect your sender reputation.
Metric 1: The Churn-vs-Revenue Tipping Point
You must find the delivery frequency where your Revenue Per Subscriber (RPS) plateaus or starts to decline while your unsubscribe rate simultaneously climbs. This intersection is your critical warning threshold, signaling that you have pushed your sending volume too far. How can you pinpoint this exact moment?
Action:
- Use a scatter plot to visually map your email volume against your RPS.
- On one axis, plot the number of emails sent per week or month.
- On the other hand, plot the corresponding RPS. This visualization will clearly show the point of diminishing returns, where sending more emails no longer results in more revenue.
Metric 2: The Engagement Threshold (90-Day Activity)
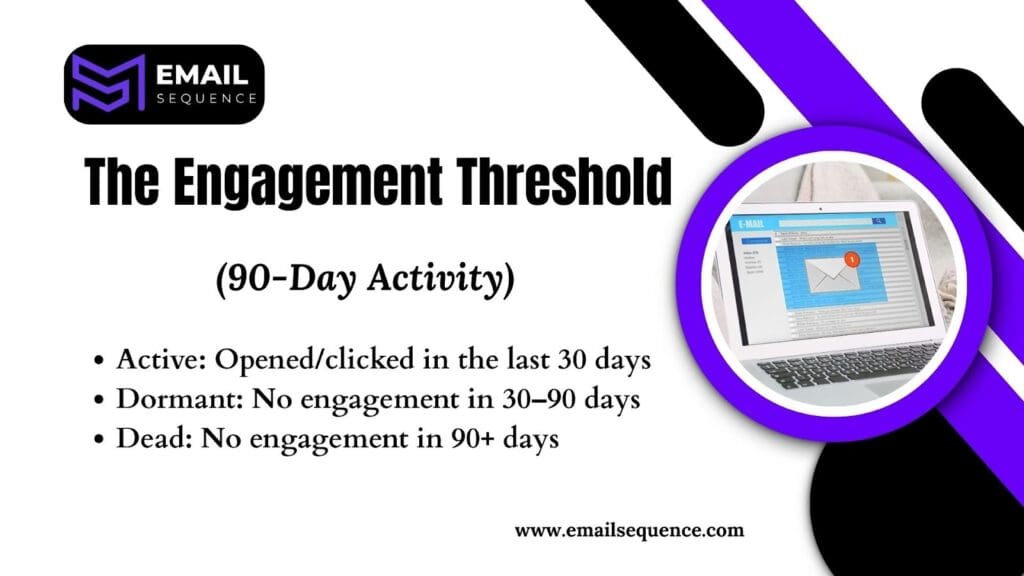
Not all subscribers are created equal. To optimize your email campaigns, it’s essential to categorize your audience into three distinct tiers of engagement based on their open and click activity over the last 90 days.
Highly engaged subscribers actively open and interact with your emails, making them your primary focus for targeted campaigns. Inactive subscribers rarely interact and may require a different approach, like a reactivation campaign or removal from your list to maintain deliverability.
- Active: Subscribers who have opened or clicked an email in the last 30 days.
- Dormant: Subscribers who have not engaged in 30-90 days.
- Dead: Subscribers who have not engaged in over 90 days.
Strategic Insight: Your email volume to the ‘Active’ segment should be three to five times higher than the volume sent to the ‘Dormant’ segment. Active users have demonstrated interest and are receptive to more frequent communication. Conversely, bombarding dormant users will likely push them to unsubscribe.
Tip: The List Hygiene Strategy:
- For the ‘Dead’ segment, create a sunset or re-engagement sequence.
- This automated campaign should aim to win back their interest.
- If subscribers don’t re-engage after the sequence, remove them from your active list.
- This improves your average engagement metrics and protects your sender reputation.
Phase 2: Behavioral Segmentation (Mastering Frequency)
Once you have defined your volume thresholds, the next phase is to use subscriber actions to dictate the precise email sending frequency. This is where you move from a broad strategy to a highly personalized one, ensuring every email is relevant and timely.
Strategy A: The Implicit Preference Model (What They Do)
Use subscriber actions and behaviors to determine the optimal email frequency for each individual. This model relies on tracking what users do, not what they say they’ll do. By analyzing their engagement patterns, you can categorize them into different frequency tiers.
Engaged Segments (High Frequency):
Send four to seven times per week. These subscribers are your most active fans. Triggers for this segment include a recent purchase, cart abandonment, or repeated content downloads. Their actions signal a high level of interest, making them prime candidates for more frequent, high-value communication.
Nurture Segments (Medium Frequency):
Send one to two times per week. These subscribers are interested but not yet fully committed. Triggers for this segment include a new sign-up or opening and clicking the last three emails without making a purchase. The goal here is to build trust and guide them toward conversion without causing fatigue.
Strategy B: The Explicit Preference Model (What They Ask For)
Allowing subscribers to choose their own email frequency is a powerful way to retain them. Many users who might otherwise unsubscribe are happy to remain on your list if they can control the volume of emails they receive.
What To Do?
- Implement a preference center: Add a section to your website where users can manage their email settings.
- Offer clear frequency options: Let subscribers choose how often they hear from you. Examples include “Daily Updates,” “Weekly Digest,” or “Sales and Promotions Only.”
- Empower your subscribers: Giving them control allows them to customize their experience and reduces the chance they’ll unsubscribe.
Phase 3: Campaign Timing & Optimization Tactics
After mastering the “what” and “how often,” the final piece of the puzzle is the “when.” Nailing your campaign timing is crucial for maximizing open rates and clicks. This phase focuses on using data to send emails at the exact moment subscribers are most likely to engage.
Tactic 1: Send Time Optimization (STO)
Many email service providers (ESPs) offer tools to automate your send times based on individual user behavior. This is one of the most effective ways to increase opens and clicks.
Action:
- Enable the Send Time Optimization (STO) feature within your Email Service Provider (ESP).
- This tool analyzes each subscriber’s historical engagement data to pinpoint their unique ideal open time.
- It then automatically sends your email campaigns to each individual at that optimal moment, maximizing the likelihood of opens and clicks.
Insight:
STO often produces better results than generalized send times (e.g., “send at 10 AM on Tuesday”). However, it requires a sufficient amount of data to be effective, typically at least 30 days of consistent sending to build accurate user profiles.
Tactic 2: Day and Time Best Practices
While STO is ideal, general best practices can still provide a solid starting point for your A/B tests. Industry-wide data can guide your initial strategy before you have enough data for full optimization. What does the general data suggest?
- B2B: Tuesdays and Thursdays often perform well, particularly in the morning, as professionals are typically at their desks and checking their inboxes.
- B2C: Weekends and evenings tend to show higher engagement, as consumers have more leisure time to browse emails and shop online.
Warning: Treat this general data as a starting point, not a strict rule. Every audience is unique. You must A/B test different days and times to discover what works best for your specific subscribers.
Tactic 3: The Automated Sequence Shield
Your most valuable automated emails, like onboarding or cart abandonment sequences, should never compete with your bulk promotional sends. Protecting these high-conversion funnels is essential.
Action:
- Pause promotional emails: Temporarily stop sending bulk promotional emails to subscribers who are currently in a high-priority automated sequence (like onboarding or cart abandonment).
- Protect user focus: This “shield” prevents subscribers from getting distracted or overwhelmed by too many messages.
- Maintain optimal performance: It ensures your most critical, high-conversion email campaigns can achieve their best results without interference.
Conclusion
Mastering email sending frequency is a continuous process of refinement. The key is to find the sweet spot between sending too many emails and too few. To do this, you must first define your tipping point by analyzing key metrics like unsubscribe and spam complaint rates.
Then, segment your audience by their behavior and engagement levels. Finally, continuously A/B test your sending frequency to optimize performance. This cycle of analysis and adjustment will help you build a resilient, profitable email program that keeps subscribers engaged without overwhelming them.
Don’t wait. Check the unsubscribe rate on your last five campaigns. If it’s over 0.5%, it’s time to adjust your email volume and sending frequency. Ready to find the perfect cadence for your subscribers? Visit EmailSequence.com to start building more effective campaigns today.
Frequently Asked Questions
What is Send Time Optimization (STO)?
STO is an ESP feature that automatically sends emails at the exact time each subscriber is most likely to open. It is based on their personal behavioral history and typically boosts open rates by 10–25% without increasing overall email volume.
What is the safest unsubscribe rate to maintain?
A healthy email program stays below 0.2%–0.5%. Anything above that means your content, cadence, or segmentation needs immediate adjustment.
How do I set email frequency based on user behavior?
Use a tiered approach:
- Engaged users: 4–7 emails/week
- Warm users: 1–2 emails/week
- Dormant users: 1 email/week (or a reactivation sequence)
Behavior-based sending delivers emails only when subscribers show intent, reducing fatigue.
What is the ideal email sending frequency?
There is no universal “perfect” frequency, but most high-performing brands email 2–5 times per week—adjusted based on subscriber engagement. The ideal send rate comes from testing your Revenue Per Subscriber (RPS) and unsubscribe trends. When unsubscribe rise above 0.3%–0.5%, you’re sending too much.